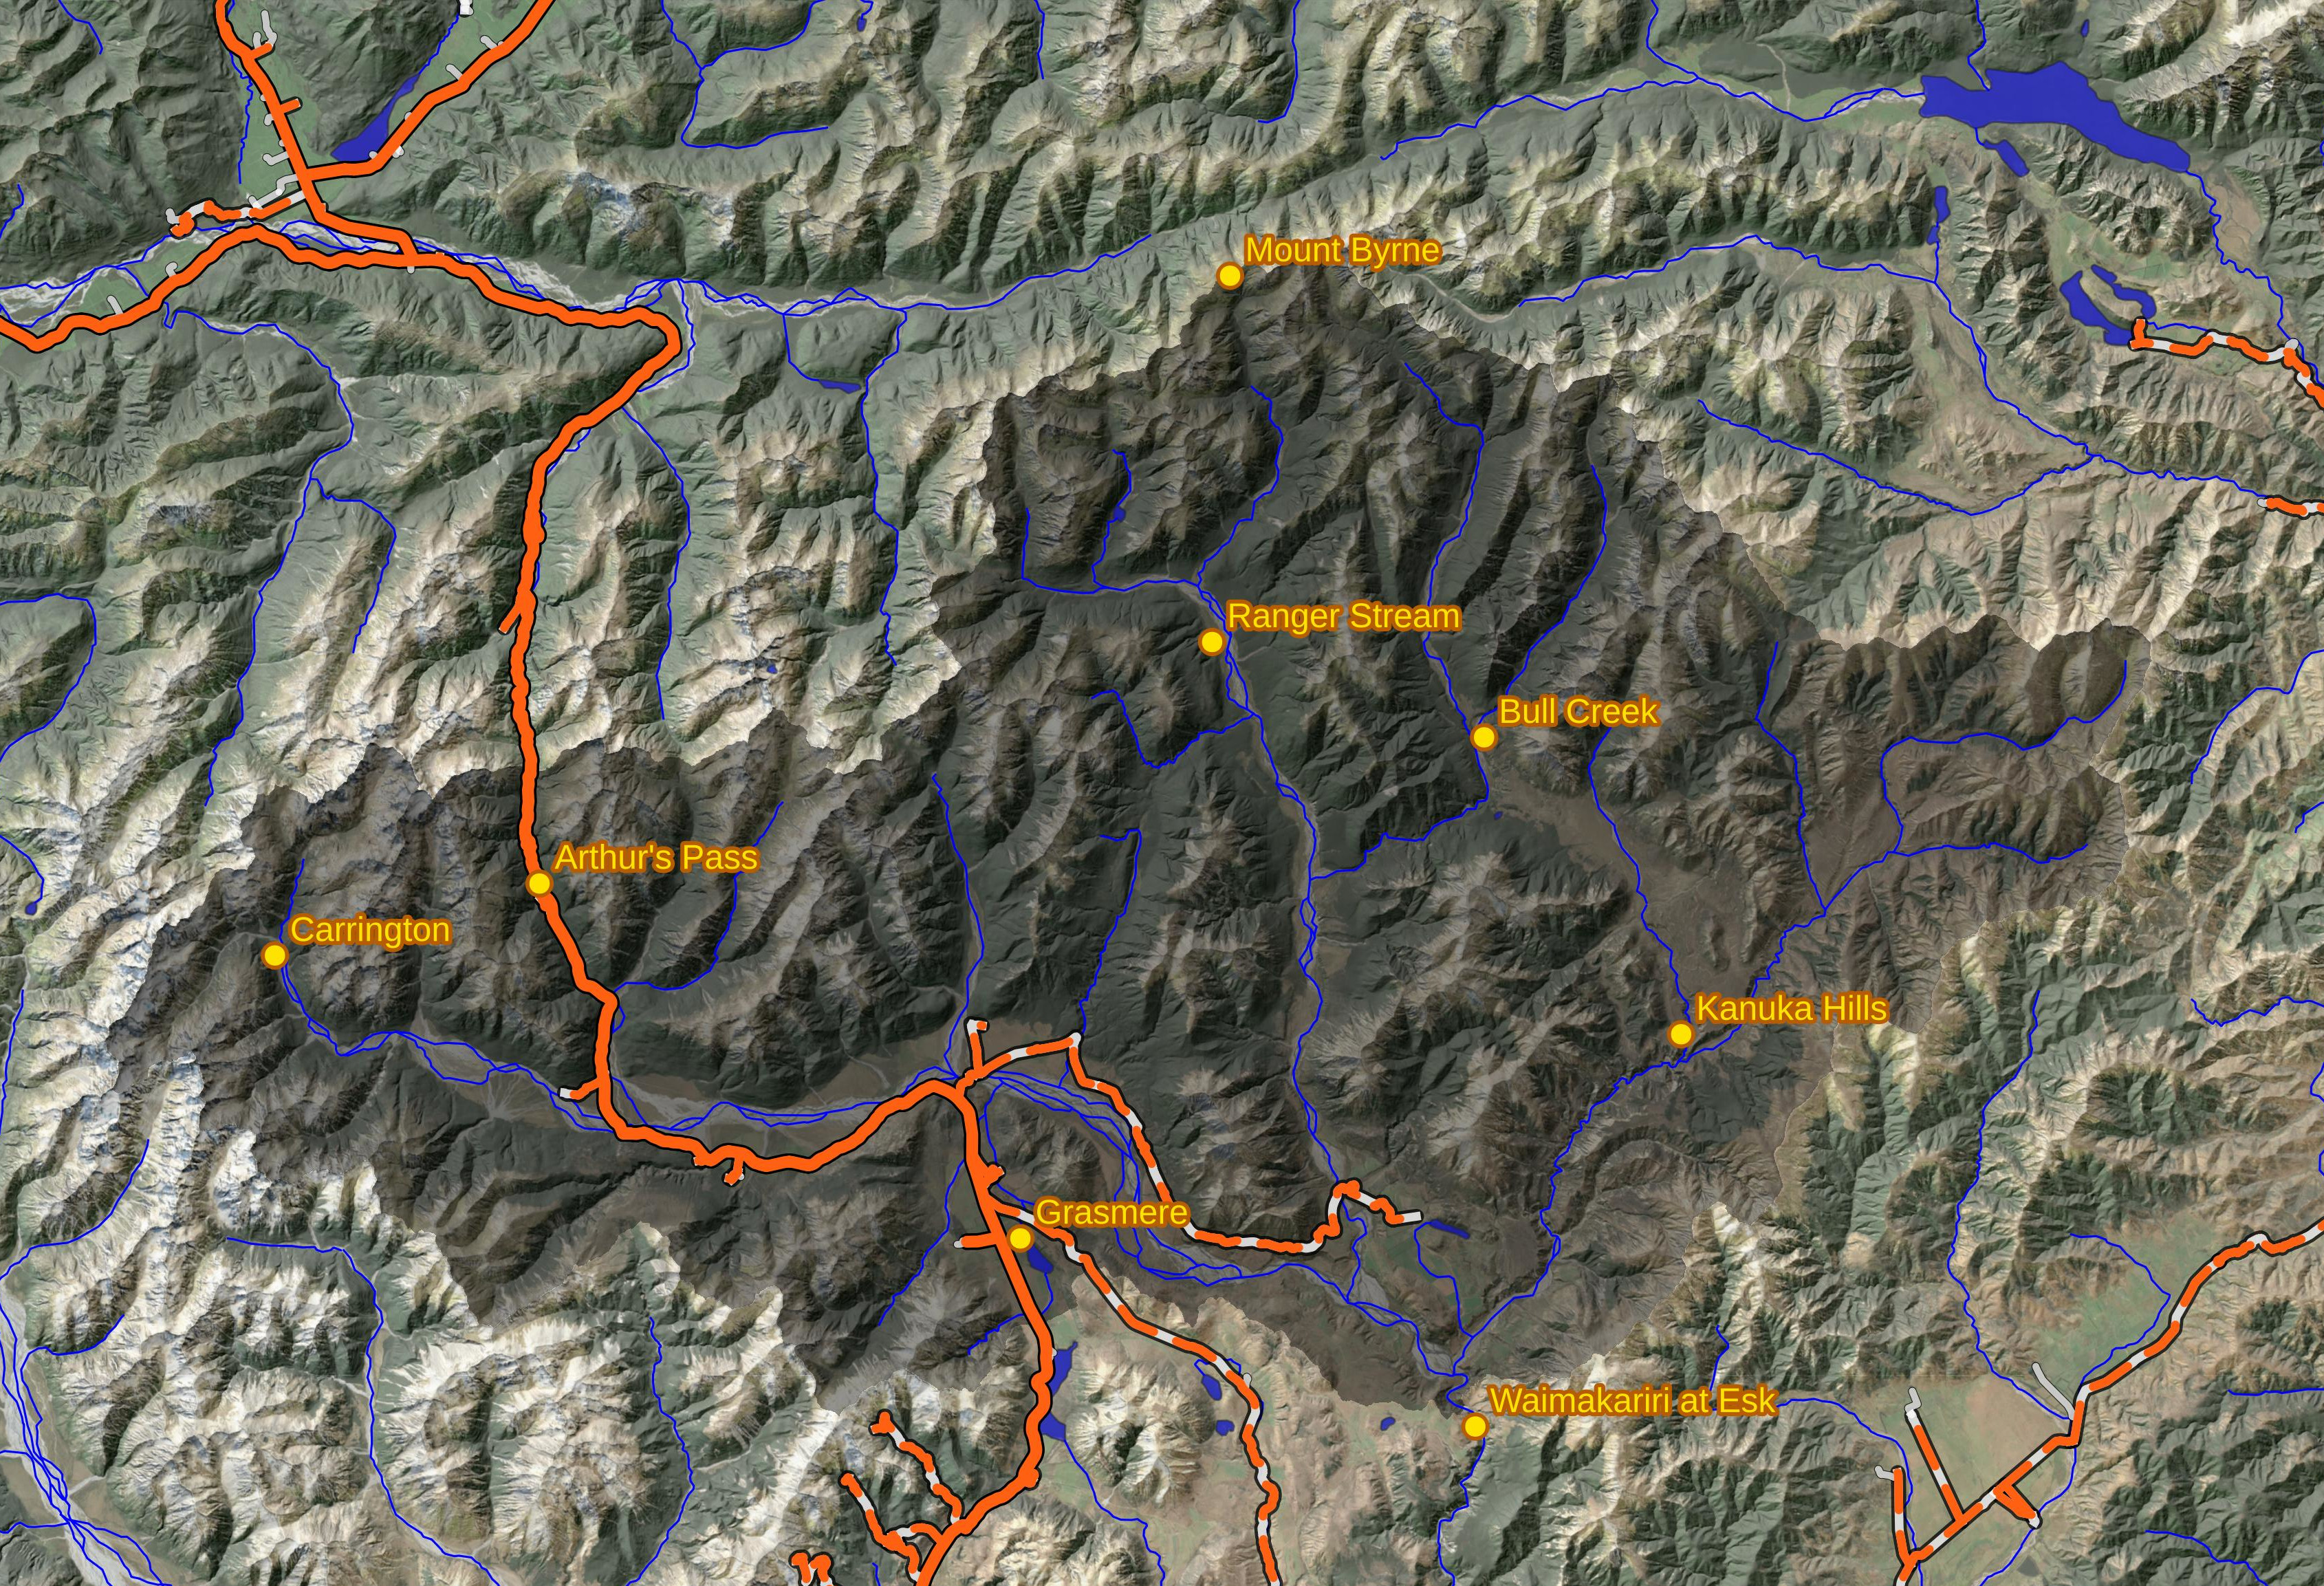
This graph shows hourly rainfall for various locations in the upper catchment of the Waimakariri River, overlayed with the river stage (height) as measured just below the confluence with the Esk river.
The dotted line represents a prediction of the stage at the Esk station six hours from when the last complete set of input data points has been collected.
You can click or control click on the site labels along the bottom of the graph to toggle data from each site on and off. Click here for a map of the catchment including the rainfall monitoring sites.
All rainfall and actual river stage data is sourced from Environment Canterbury. A Long Short-Term Memory (LSTM) recurrent neural network (RNN) is used to produce the predicted stage values. The network is still being refined and is usually retrained after major flood events.
Please do not rely on the predicted value for any life critical activities, this graph is a guide only.